
Stat the Landing
Inspecting FAA Delays
GA-DSI Project 7
TO: Michael Huerta, FAA Administrator
FR: A. Joshua Bentley, Tower Tabulation
RE: Airport Delay Analysis
You had tasked me to investigate delays in general airline traffic, expressing specific concern that there were airports whose performance had failed to improve despite previous efforts.
A more detailed report on how the results were obtained is attached to this executive summary.
You had supplied me with a generous amount of information, and while the target was current performance the prior years were central to this project.
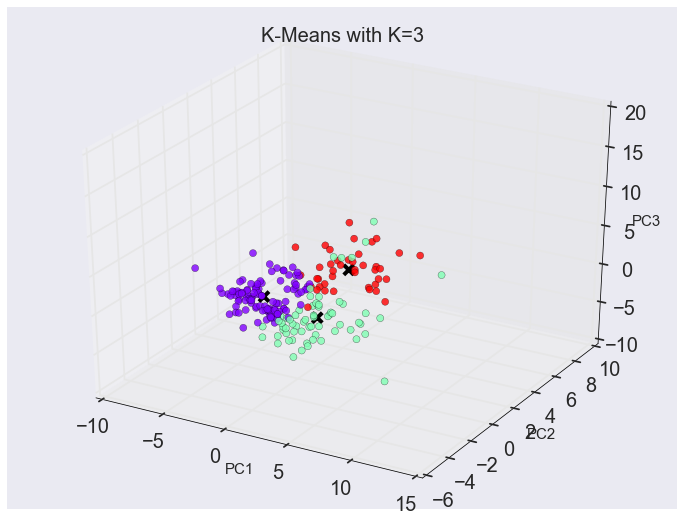
My first step in identifying the “problem children” was to identify groups of airports that had similar performance in terms of delay and arrival timing and their changes over from five years prior. In order to have a more robust data set I used information from 2012-2014 for this step, rather than just 2014.
Please note that while there was considerable colinearity (measurements that relied upon each other, such as number of arrivals and number of departures), the methodology I used took this into account.
I found that there were three clear groupings, or clusters.
Cluster A
20 Airports
| Airports | |||
|---|---|---|---|
| ANC | OMA | PSP | SJU |
| CVG | PBI | PVD | SLC |
| DTW | PDX | RDU | SNA |
| HOU | PHL | SAT | STL |
| MCI | PIT | SDF | SWF |
| Basic Stats | # Departures |
|---|---|
| Average | 68,146 |
| Smallest | 955 |
| Median | 59,633 |
| Largest | 205,899 |
Cluster B
36 Airports
| Airports | |||
|---|---|---|---|
| ABQ | DAL | JAX | MSY |
| AUS | DAY | JFK | OAK |
| BDL | DCA | LAX | OGG |
| BHM | FLL | MCO | ONT |
| BNA | HPN | MDW | RSW |
| BUF | IAD | MEM | SEA |
| BUR | IAH | MHT | SJC |
| BWI | IND | MIA | SMF |
| CLE | ISP | MSP | TPA |
| Basic Stats | # Departures |
|---|---|
| Average | 77,477 |
| Smallest | 5,546 |
| Median | 61,002 |
| Largest | 245,284 |
Cluster C
13 Airports
| Airports | |||
|---|---|---|---|
| ATL | DFW | LGA | ORD |
| BOS | EWR | LGB | PHX |
| CLT | LAS | MKE | SFO |
| DEN |
| Basic Stats | # Departures |
|---|---|
| Average | 225,746 |
| Smallest | 32,791 |
| Median | 206,239 |
| Largest | 428,954 |
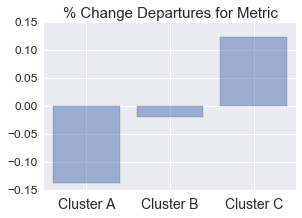
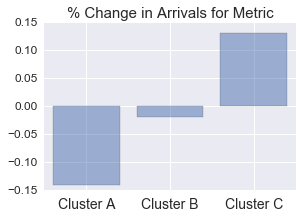
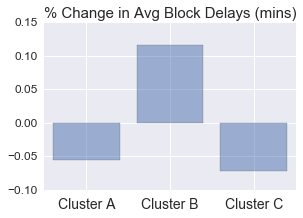
The Metrics
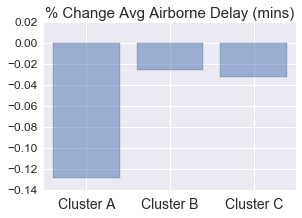
Summary
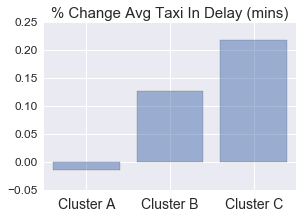
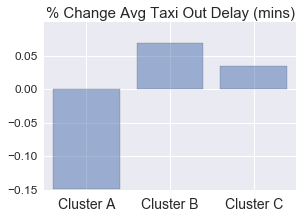
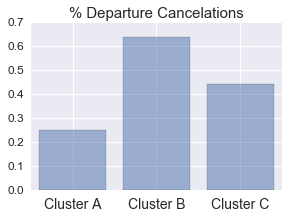
While Cluster C has its problems, Cluster B is clearly dragging the rest of the system down. Their biggest problems seem to stem from weakening taxi systems with Taxi In delays up +13% from 5 years ago and Taxi Out delays are up +5%.
While Taxi In delays are worse for Cluster C they have the “excuse” of traffic having grown substantially in that time while Cluster B hasn’t changed much.
This seems to be a very surmountable barrier that simply calls for organizational and operational improvements.
Next Steps
While ample data was supplied, it is possible that more information would expose information that might change the results.
It would be significant to see meteorological data, which I have to imagine the FAA collects, to show whether temperature and precipitation have seen significant shifts in this time.
It could be useful to see whether there is any difference in monthly numbers. Has tourism increased?
Have there been changes in the airlines serving the airport or in the sources / destinations of the planes. If flights from Denver tend to be late and they’ve just started a new direct flight from Denver to DC then the delays in DC would change.