
Iowa Liquor Store Expansion Project
GA-DSI Project Week 3
Personal Reflections
This was an unusual experience for me as I was working with one person who had programming in his background, albeit not in Python, and another who was very strong in Python while I am still hunting my way through.
Basically I had no hope of keeping up with my teammates when it came to coding.
That being said, it was an intensely educational experience as I kept reading through their code and taking notes on it. They were good about walking me through things that I couldn’t figure out, too, and I spent some time trying to tinker with what they’d written as well as to try to duplicate it.
Where I felt I was a strong contributor was in designing the strategy, putting on my marketing hat and thinking about what someone would need to know in order to successfully target new locations for a store. This helped us uncover the fact that Iowa is the state wholesaler and that there was no actual retail pricing available to us. I felt strongly that demographics were vital to the project and went out to find data and process it so that it could be brought into the analysis.
While JP and Jocelyn did the heavy lifting code-wise, in the end I felt like I held up my end of things and that I learned more than I might have if I had been as equal a contributor to the coding. Still, I’m eager to get there. Impatient is probably a better word.
That being said, this was a really fun project for me, just because I apparently enjoy marketing studies (who knew?!?)
And now…the main event!
J3 Analytics for Hawkeye Hooch Liquor
A model for expansion of Hawkeye Hooch Liquor stores
GA-DSI Project 3
Joshua Bentley, JP Freeley, Jocelyn Ong
![]() ,
, ![]()
Project Goal
Hawkeye Hooch, a liquor store owner in Iowa, is looking to expand to new locations and has hired J3 Analytics to create a model to guide them to successful new locations. Hawkeye Hooch is interested in the details of the best model we can fit to the data so that their team can evaluate potential locations for a new storefront.
Inspect the Data
J3 was provided with an initial data set from the state reflecting liquor transaction for the previous 15 months. While inspecting this data we discovered that the state of Iowa acts as the alcohol wholesaler to stores in the state and that the prices listed in the database as retail were the prices stores paid to the state. There was no retail pricing available for the final transaction (store to consumer).
Several options presented themselves:
- Assume a flat profit margin for all products, essentially making the retail price a proxy for the final transaction price.
- Randomize profit margins.
- Survey market for direction
We decided to use the first option. #2 would introduce unnecessary and inaccurate complexity and #3 would be costly in terms of time and might not be vital for outcome. #3 will, however, be listed in next steps, as it would be vital for a more accurate read of the market.
As we discussed how to use the liquor sales data given we decided that it was insufficient to answer our client’s needs. To suggest what markets should be targeted for new stores it was necessary to know more about the people in those markets.
We were able to draw demographic, housing, and business information from the Iowa Data Center website. These data were dated with some reflecting information as far back as 2004. Another next step for this project would be to secure current information. They would, however, serve for this initial model.
Clean the Data
After importing the liquor sales csv into Pandas we found that there was significant work to do in order to make it usable.
- Convert “Date” to datetime format
- To ensure accuracy, we imported a list of Iowa zip codes, cities, counties, county numbers, and zip code areas in square meters from unitedstateszipcodes.org, iowayouthsurvey.iowa.gov/images/iacountiesnumbers.pdf, and 2010 TIGER/ESRI shape files.
- Zip codes required considerable cleaning as there were some zip codes that were not in the state, some that did not exist, and one that was in an unreadable format ( ‘712-2’).
- Using the additional zip code data available to us we were able to identify and correct the majority of these.
- All dollar-based metrics were then converted to floats.
Cleaning was less onerous for the demographic data. Zip codes were converted from strings to integers and symbols and punctuation (‘,’, ‘%’, ‘$’, ‘-‘) were removed from cells in order to allow them to be converted to floats. Once this data had been cleaned the two data sets were merged on zip code.
Mine the Data
We considered how to address the dates of the available data and determined that we should dismiss seasonality as a consideration. The question of how to optimize sales through the year is secondary to where to establish the new store.
For expediency sake we chose to set the 2016 data aside and concentrate on building the model based solely on 2015 data.
To achieve this we created a column reflecting the year and eliminated rows that held 2016 transactions.
Additional columns were added reflecting dollars per liter sold and stores per square km in each zip code.
Dollars per liter indicates where store in a zip code sit in terms of price and volume.
- A high-end store would have high price and low volume (and a high dollars per liter)
- a bargain bulk distributor would have low price and high volume (and a low dollars per liter).
- These data points will be useful if the client decides to focus on one of these formats for an expansion.
Stores per square km indicates market saturation. The model, utilizing demographic information about the zip code, will determine the extent to which an area’s saturation is a benefit or a drawback.
- A zip code that already has several liquor stores will either be:
- oversaturated, in which case it would be a poor choice
- a strong enough market that it might be able to support another store.
- A zip code that has no or very few liquor stores will either be:
- a location that has no need for a liquor store
- a location that is an untapped market
Explore and Refine the Data
Armed with the liquor sales and demographic data we looked at how each feature correlated with three targets: bottles sold, total sales, and volume sold (in liters). For each we generated histograms to visually understand what we could glean from our data.


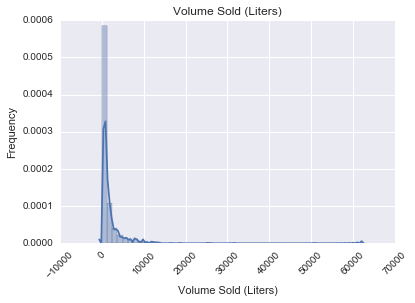
In doing so we found that there were a handful of stores that had extremely high sales. Investigation uncovered that at least one of these was a store that acted primarily as a distributor to bars.
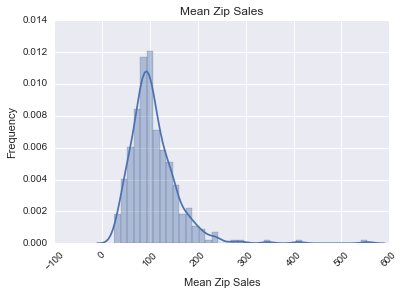
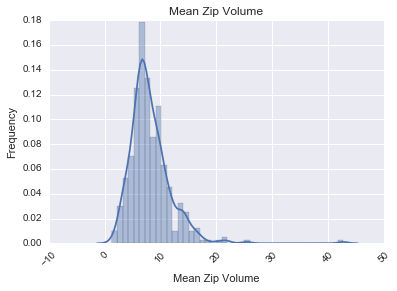
The next analyses were for mean zip sales and volume:
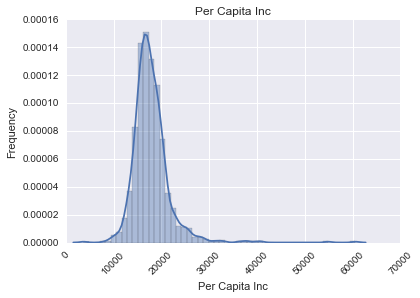
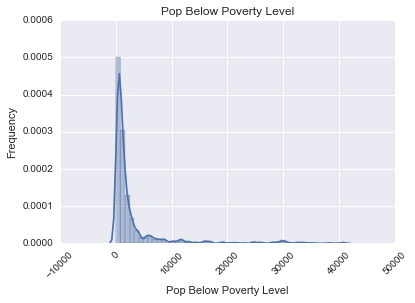
Having seen what the liquor sales data set could give us we then examined some of the demographics. Some examples include per capita income by zip code, which had a normal curve, the population by zip code living below the poverty line, which was right-skewed, and the percent of persons aged 16 or older that were in the work force by zip code, which was also normal.

Removing the outliers
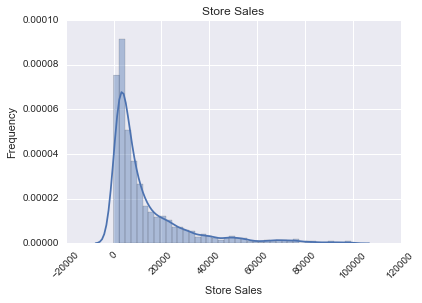
In order to see the impact our outliers had on the data we aggregated the stores’ sales and volume and created the below histograms:

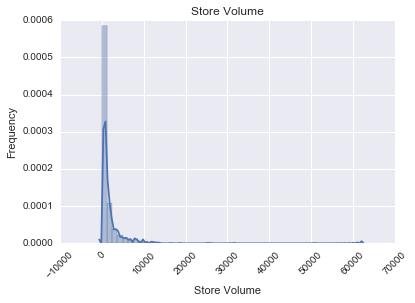
We then eliminated stores with sales over 3 SD away from the median, setting the cutoff at $100,000. This resulted in visible changes:

Means and Metrics
We next looked at what the mean sales and volume sold were by zip:
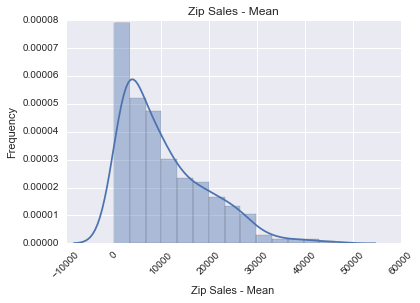

Both of these were strongly right-skewed.
We then calculated the mean price by zip in dollars per liter and created a store count for later use in a saturation study.
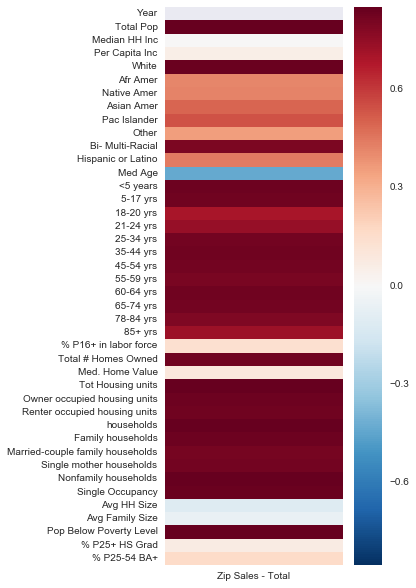
Heat Maps
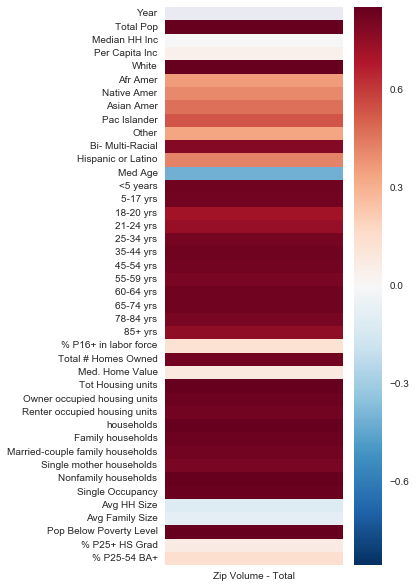
In order to better understand the impact of each of our features on the model we created heat maps plotting each feature against a target, first by total sales
and then by total volume sold.
The Models and the Results
Our models describe the viability of a zip code to host a new Hawkeye Hooch location using a broad set of features, primarily derived from demographic information.
We eliminated several features that we determined were either inter-dependent (if one went up or down the others would go up or down in unison) or wouldn’t be relevant to the final product.
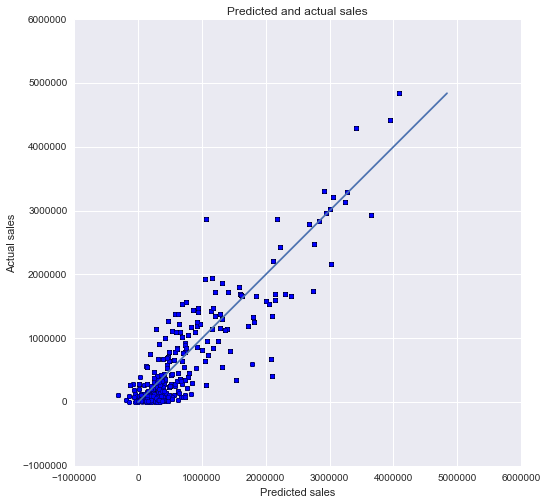
We ran the remaining features through a model with total sales as the target. Lasso cross-validation of the model resulted in an r-squared of 0.854 and an alpha of 0.1.
Running the features through a model with dollars per liter as the target resulted in a Lasso CV with an r-squared of 0.861 and an alpha of 0.1.

Conclusions
Below you’ll see a table reflecting the best performing zip codes according to our model, followed by a map showing where each of these zip codes are geographically.
You will see from the table that based on the test set of 10% of the year’s transactions the predicted values average within 13% of the actual sales from 2015 so we feel confident that this model will serve Hawkeye Hooch well as it searches for its next location.
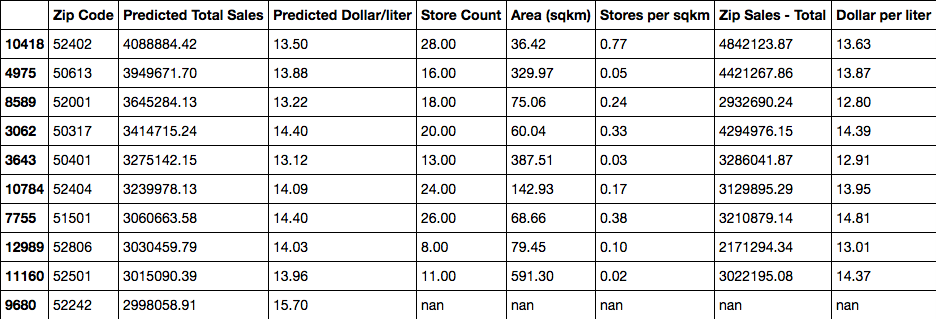
You will notice that in the last line of the table there are a series of “nan” notations. These indicate that there is currently no liquor store in that zip code (or, at least, no transactions for one appeared in the test set used to build the model). This is an indicator that the model is working, though.
Zip code 52242 is in University Heights, a suburb of Iowa City near the University of Iowa. This seems like an excellent location to consider for the expansion.
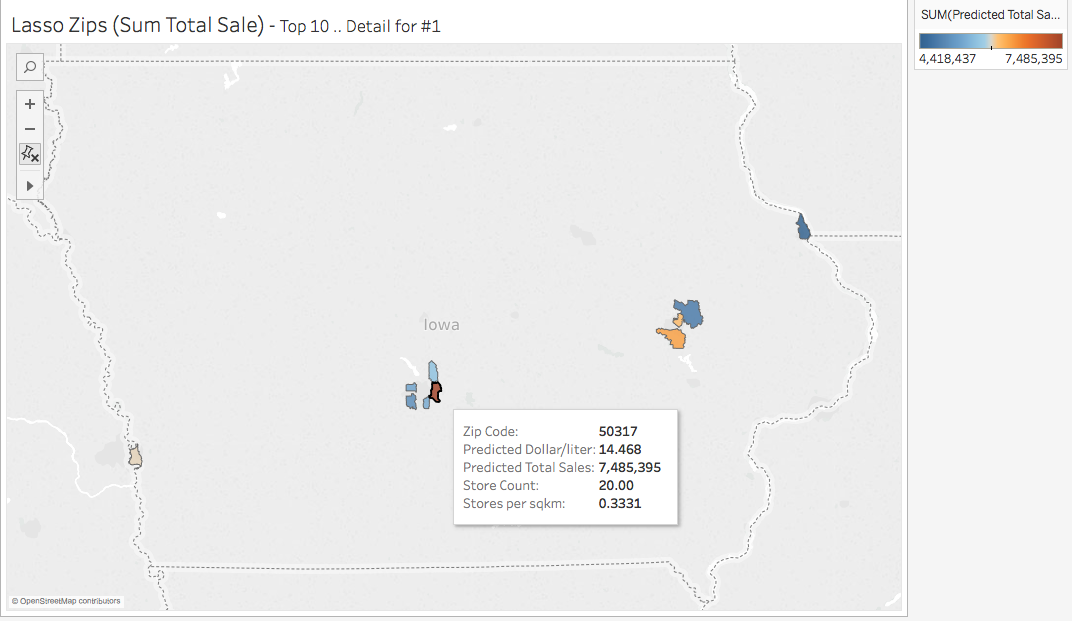
The inset box on the map describes some of the key details of that zip code, 50317, in Pleasant Hill. This is the top performer in our model and we predict that a store there could make nearly $7.5 million per year at a rate of just under $14.50 per liter. There are currently 20 stores in that zip code and 0.33 stores per square kilometer.
These maps show where our model thinks you’d have the most success.
The first map uses a Lasso cross-validation to show what zip codes are most likely to support a store making over $2,000,000 a year:

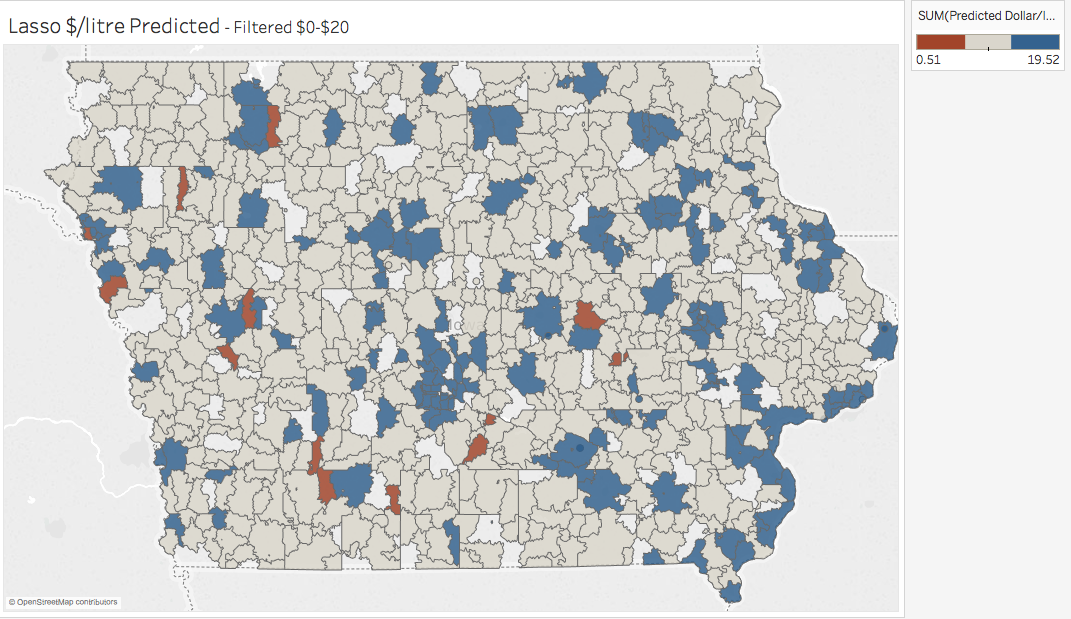
The model can be modified for targets other than total sales. For example, this map identifies which zip codes are most likely to earn you the best profit per volume sold according to our model:
Next Steps
Utilizing the demographic data was vital in providing this model’s strong results and before implementing it J3 urges Hawkeye Hooch to acquire current data as neighborhoods can undergo significant changes over time.
If Hawkeye Hooch is interested in focusing on a particular type of sales format, such as a high-end store or a bulk distributor, adding consumer retail price to these data is vital. The liquor sales data as given allows for no real insight into how profitable any store might be.
These data could also be utilized to determine the viability of service expansions, such as home delivery, or increased marketing focus utilizing ethnicity, age, or family status.
In order to promote a positive social image, Hawkeye Hooch may want to also use the data from this project to identify areas where drinking may be problematic and to introduce messaging promoting responsible consumption. The demographics data shows areas of high poverty and low employment, for example.