
Parkside Parenting Partners Model and Clusters
For the next portion of this project I made a classification model to determine whether someone is likely to be a long term or short term member. I’ll then do a PCA and cluster analysis to help PPP better understand their members’ needs.
Modeling
It occurred to me that it would be useful for PPP to know what factors contributed to a family being a long-term versus a short-term member. To create this classification model I first needed to determine how to define a long-term versus a short-term member.
Median membership is 2.83 years, but heavily skewed towards those with 1-year memberships. I saw that many families let their memberships lapse when their child was 22 months old and so I decided that 2 years seemed like the ideal choice.
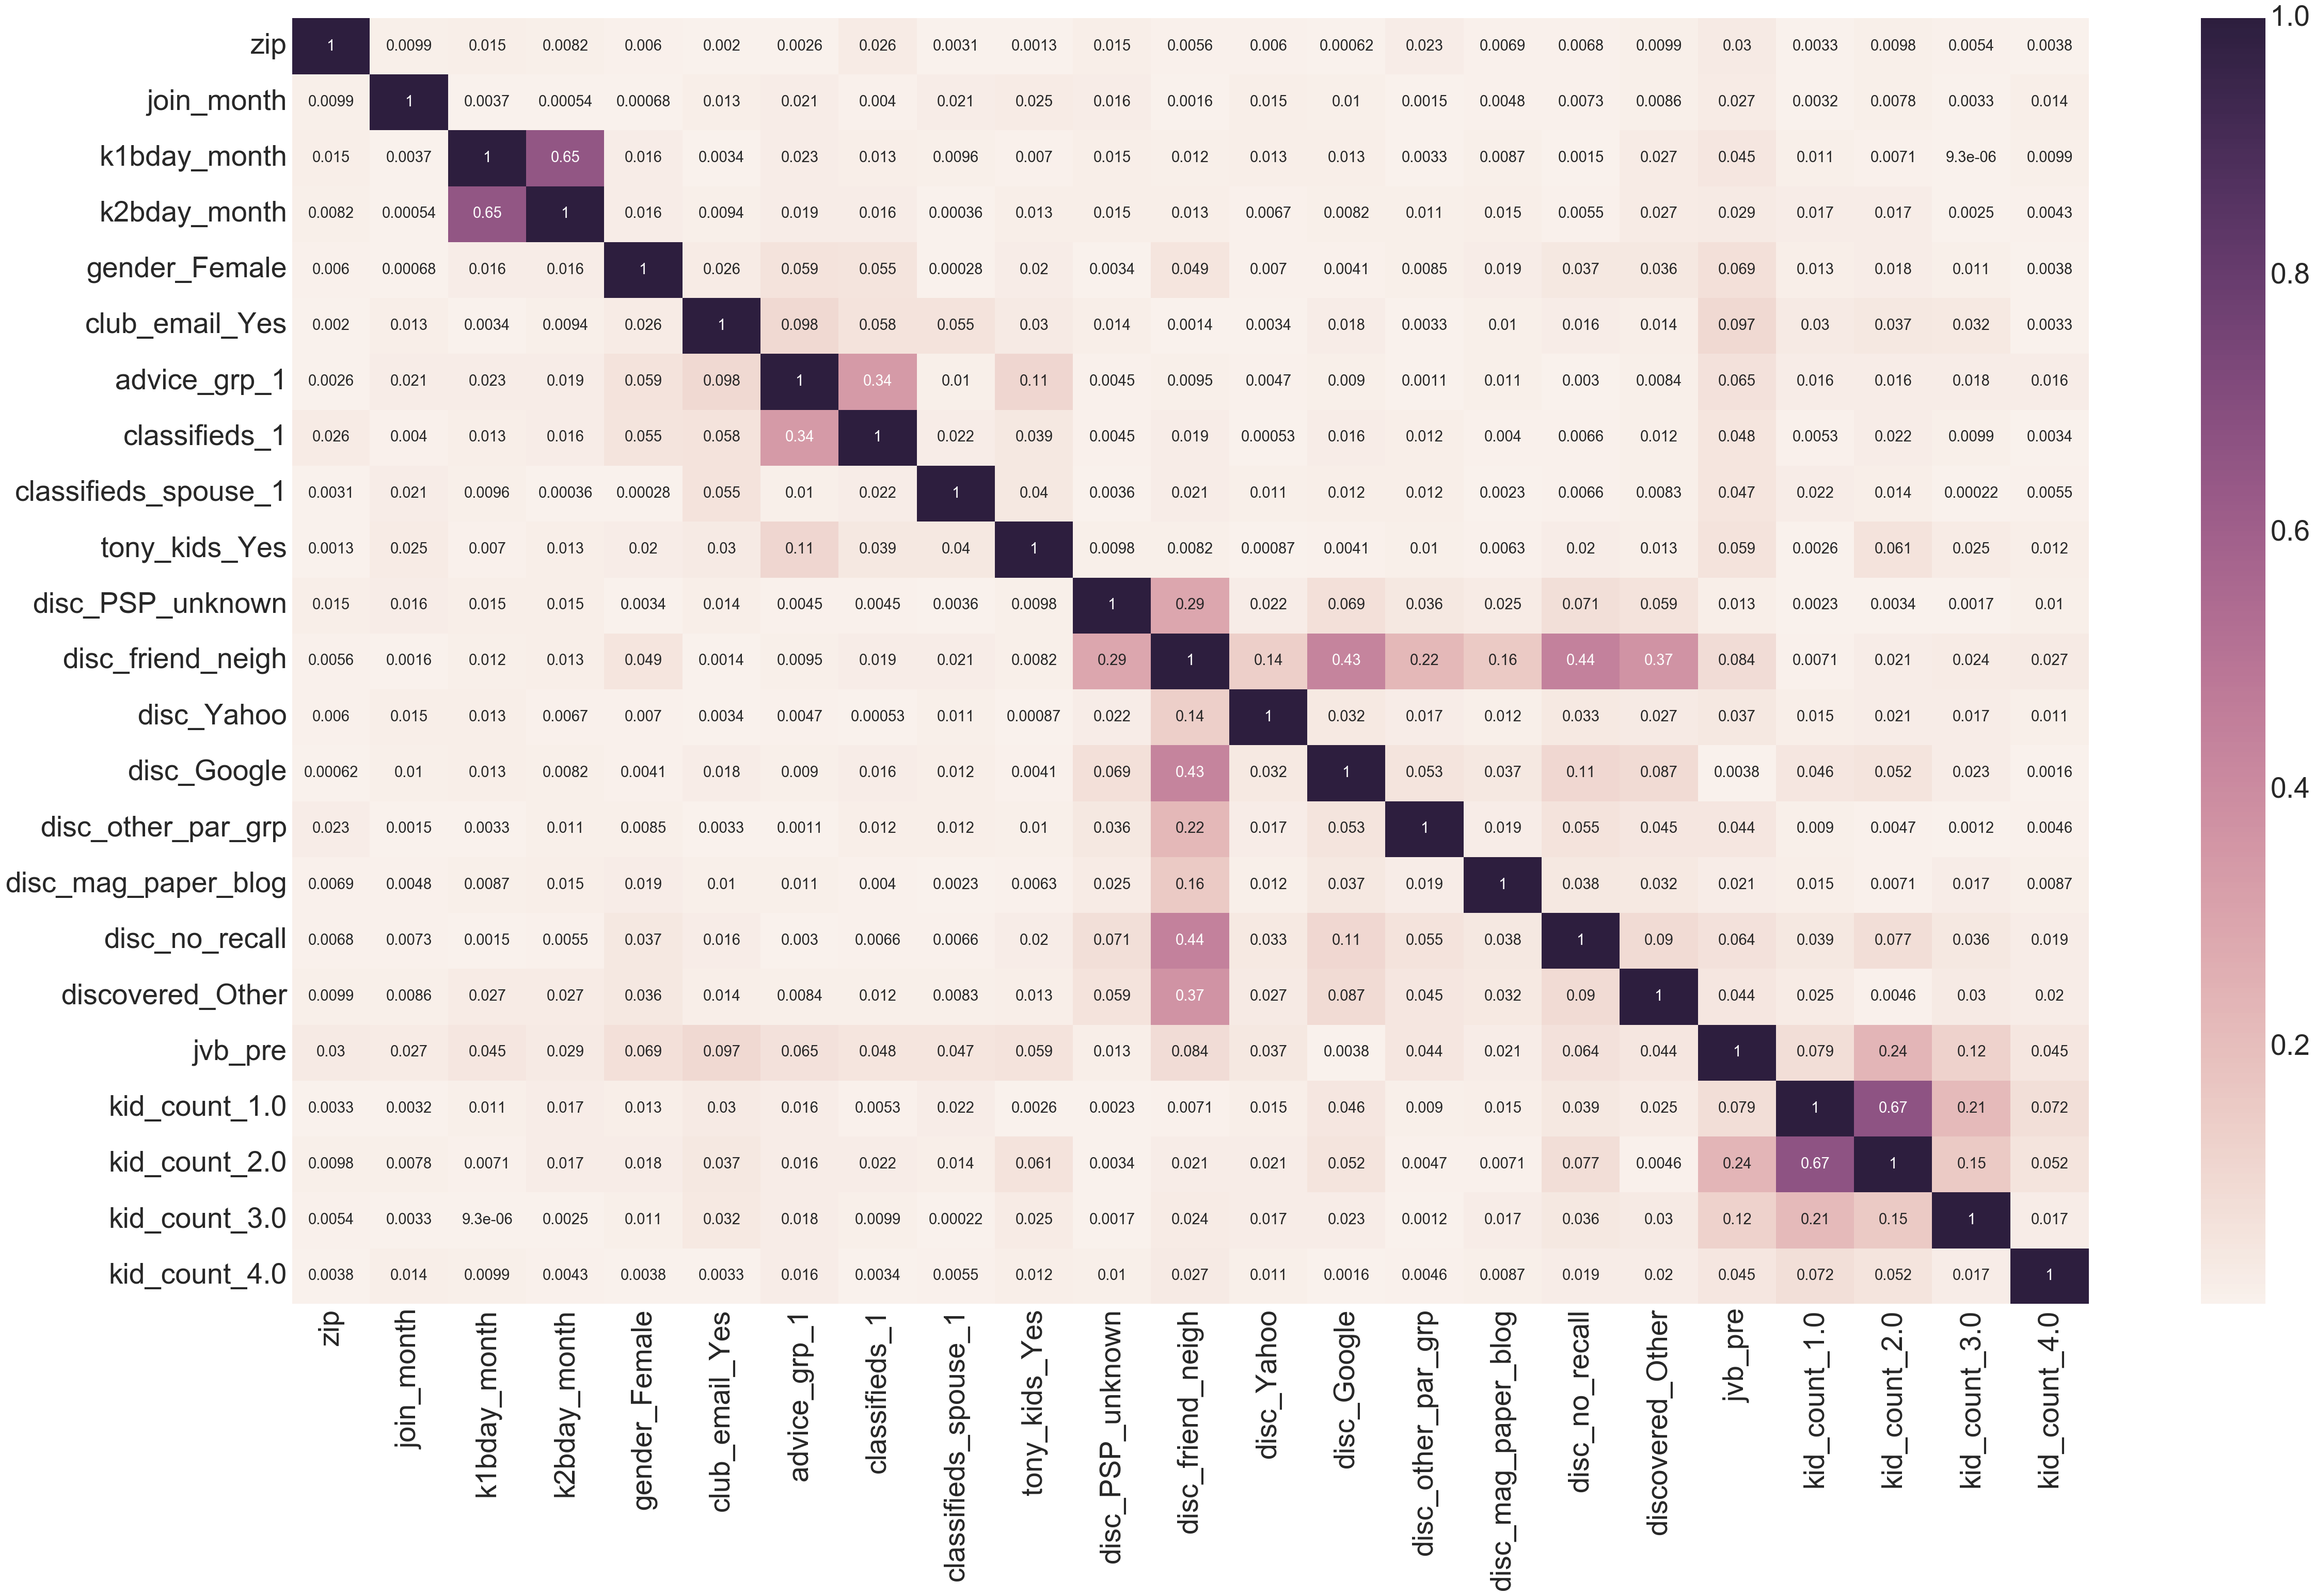
After applying a standard scaler I fit the data to a logistic regression model with Ridge regression. I actually ran the model three times as I realized after the first one that I had two features that should have significant colinearity, both indicating a family joined while still expectant but one being self-reported and the other being calculated. Their correlation was in the 50s which seemed impossible. I ran the model again once with the self-reported feature omitted and the next with the calculated feature omitted.
Eliminating the self-reported feature improved performance and is what is detailed below.
Coefficients
The strongest absolute coefficients are:
- joined pre-birth (-2.35)
- 2 kids (+3.92)
- 3 kids (+3.85)
- 1 kid (+3.25)
- spouse subscribed to classifieds list (+1.05)
The negative coefficient for expectant families mean that expectant parents have been the least likely to retain membership past 2 years. This aligns with the 22 months shown as the average number of months a child was when a family let its membership lapse.
Confusion Matrix
This matrix shows the results of the model’s prediction during the cross-validation. Of the 4,816 members tested, the model accurately predicted that someone was a long-term member 1,338 time and accurately predicted that someone was a short-term member 2,124 times.
574 times the model predicted a member would be long term but was actually short term and 780 times it predicted short term but was actually long term.
This means that the model correctly predicted long or short term 78% of the time.
|– | Predicted Long | Predicted Short |
|——–|————|——————|
|Long-term | 1338 | 780 |
|Short-term | 574 | 2124 |
The below graph shows the likelihood of the model predicting a Type I (False Positive) error. The ROC score of .79 is the area under the blue curve and represents that 79% of the time the model predicts a member will be long term it will be correct. The dotted line represents where it would be 50/50.
Once I had the lostistic regression model established I ran through a series of ensemble classifiers, none of which scored as well as the logistic regression.
Clustering
In order to help PPP better understand their members I ran a Principle Component Analysis and Cluster analysis.
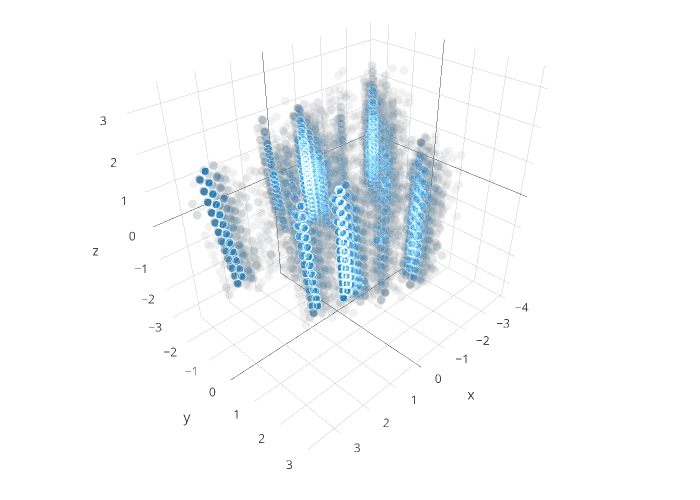
PCA revealed that features could be condensed into three principle components that would explain 100% of the variance in the data.
Visualization of 3 PCAs for PPP data
DB-SCAN suggested that 2 clusters would be ideal, but I felt that my client would be better served with three, especially since the silhouette scores (how well defined the clusters were in terms of space between the clusters) between 2 and 3 clusters were almost the same.
The below graph confirms I belief:
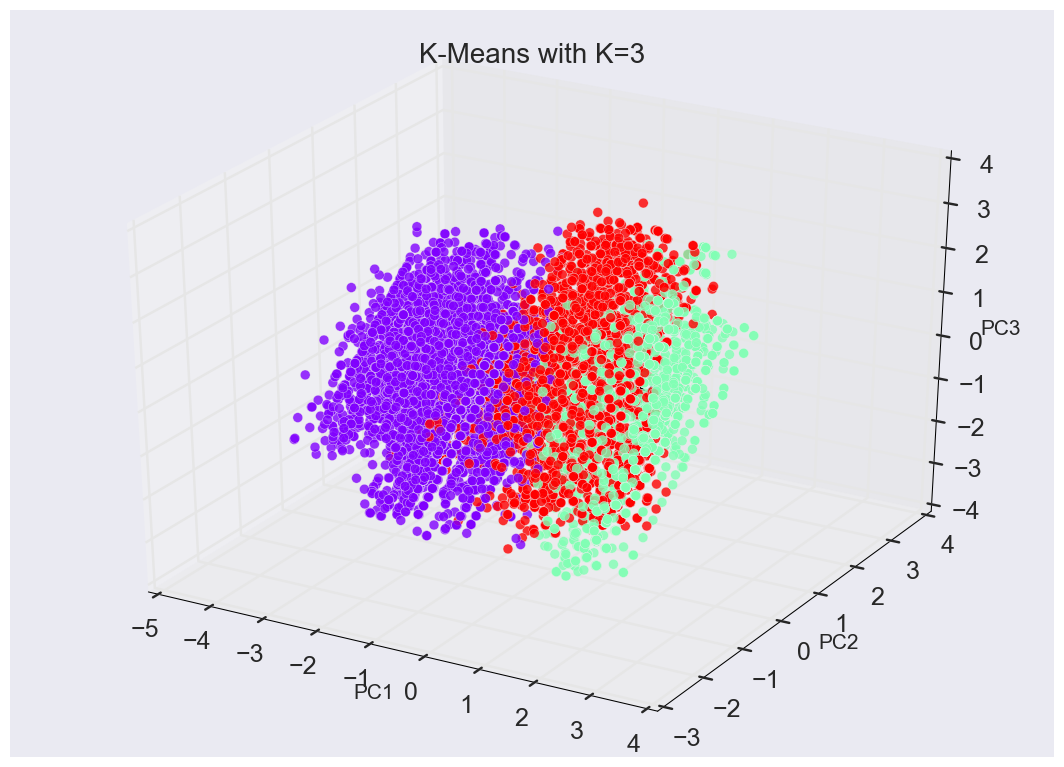
Clustering Summary:
Cluster A:
- 36% of members
- Cluster A members are more likely to be long-term members than either of the other clusters, which are fairly even split between long and short.
- None of these members had 1 child, almost all had 2
Cluster B:
- 27% of members
- I’m not sure how this could be actionable, but it’s interesting that children in this cluster were born later in the year than children in Clusters A and C
- These members were far less likely to have joined the group while pregnant than members of the other two clusters.
- Members in this cluster were the most likely to have found PPP through a friend or neighbor who is also a member of the group.
- The other clusters were much more likely to have found PPP through another parenting group than the other clusters.
- very few of these members had more than 1 child.
Cluster C:
- 37% of members
- These members were much more likely to have found PPP through Google than the other clusters were
- Almost all of these members were single-child families.
Additional posts on this project can be found at:
Parkside Parenting Partnership Project Introduction
Parkside Parenting Partnership Model and Clustering